Understand the value of Sourcegraph with admin analytics
Sourcegraph's new admin analytics make it easier for admins to understand user engagement, measure efficiencies, and quantify the value of Sourcegraph.
Sourcegraph's new admin analytics make it easier for admins to understand user engagement, measure efficiencies, and quantify the value of Sourcegraph.
Sourcegraph was created to improve developer efficiency. By providing the ability to see how frequently an API is used across a company's code, by making it incredibly fast to find and share examples of how a function is used, or understand the scope of a vulnerability and fix it, we're reducing duplicated efforts, reducing time spent looking for knowledge, and generally making development more efficient.
Delivering that efficiency to end users requires talented and dedicated admins who also deserve great tools. In recognition, we've recently taken on the goal of building a world-class product admin experience and we're excited to release improved admin analytics as the first step towards that goal.
Our new analytics feature will make it easier for admins to do three main things: understand user engagement, measure efficiency in terms of time saved, and help calculate the value of utilizing Sourcegraph and its features. Admins will be able to quickly see how many searches have been run, the number of users who have done so, the usage of code navigation across several key use cases, and other feature-level data. We've also made it easy to calculate the developer time saved by each feature and give admins the flexibility to determine that calculation for themselves.
We chose time saved as a measure of value because every time a developer uses search to find an answer to a problem on their own, they save time. Not only for themselves but for the engineers they would have asked to provide input as well. When a single developer automates repetitive changes that previously required a concerted effort of communication and management to achieve, everyone saves time. When developers can more effectively collaborate over a solution, everyone saves time. Delivering this time saved back to our customers is why we built the product.
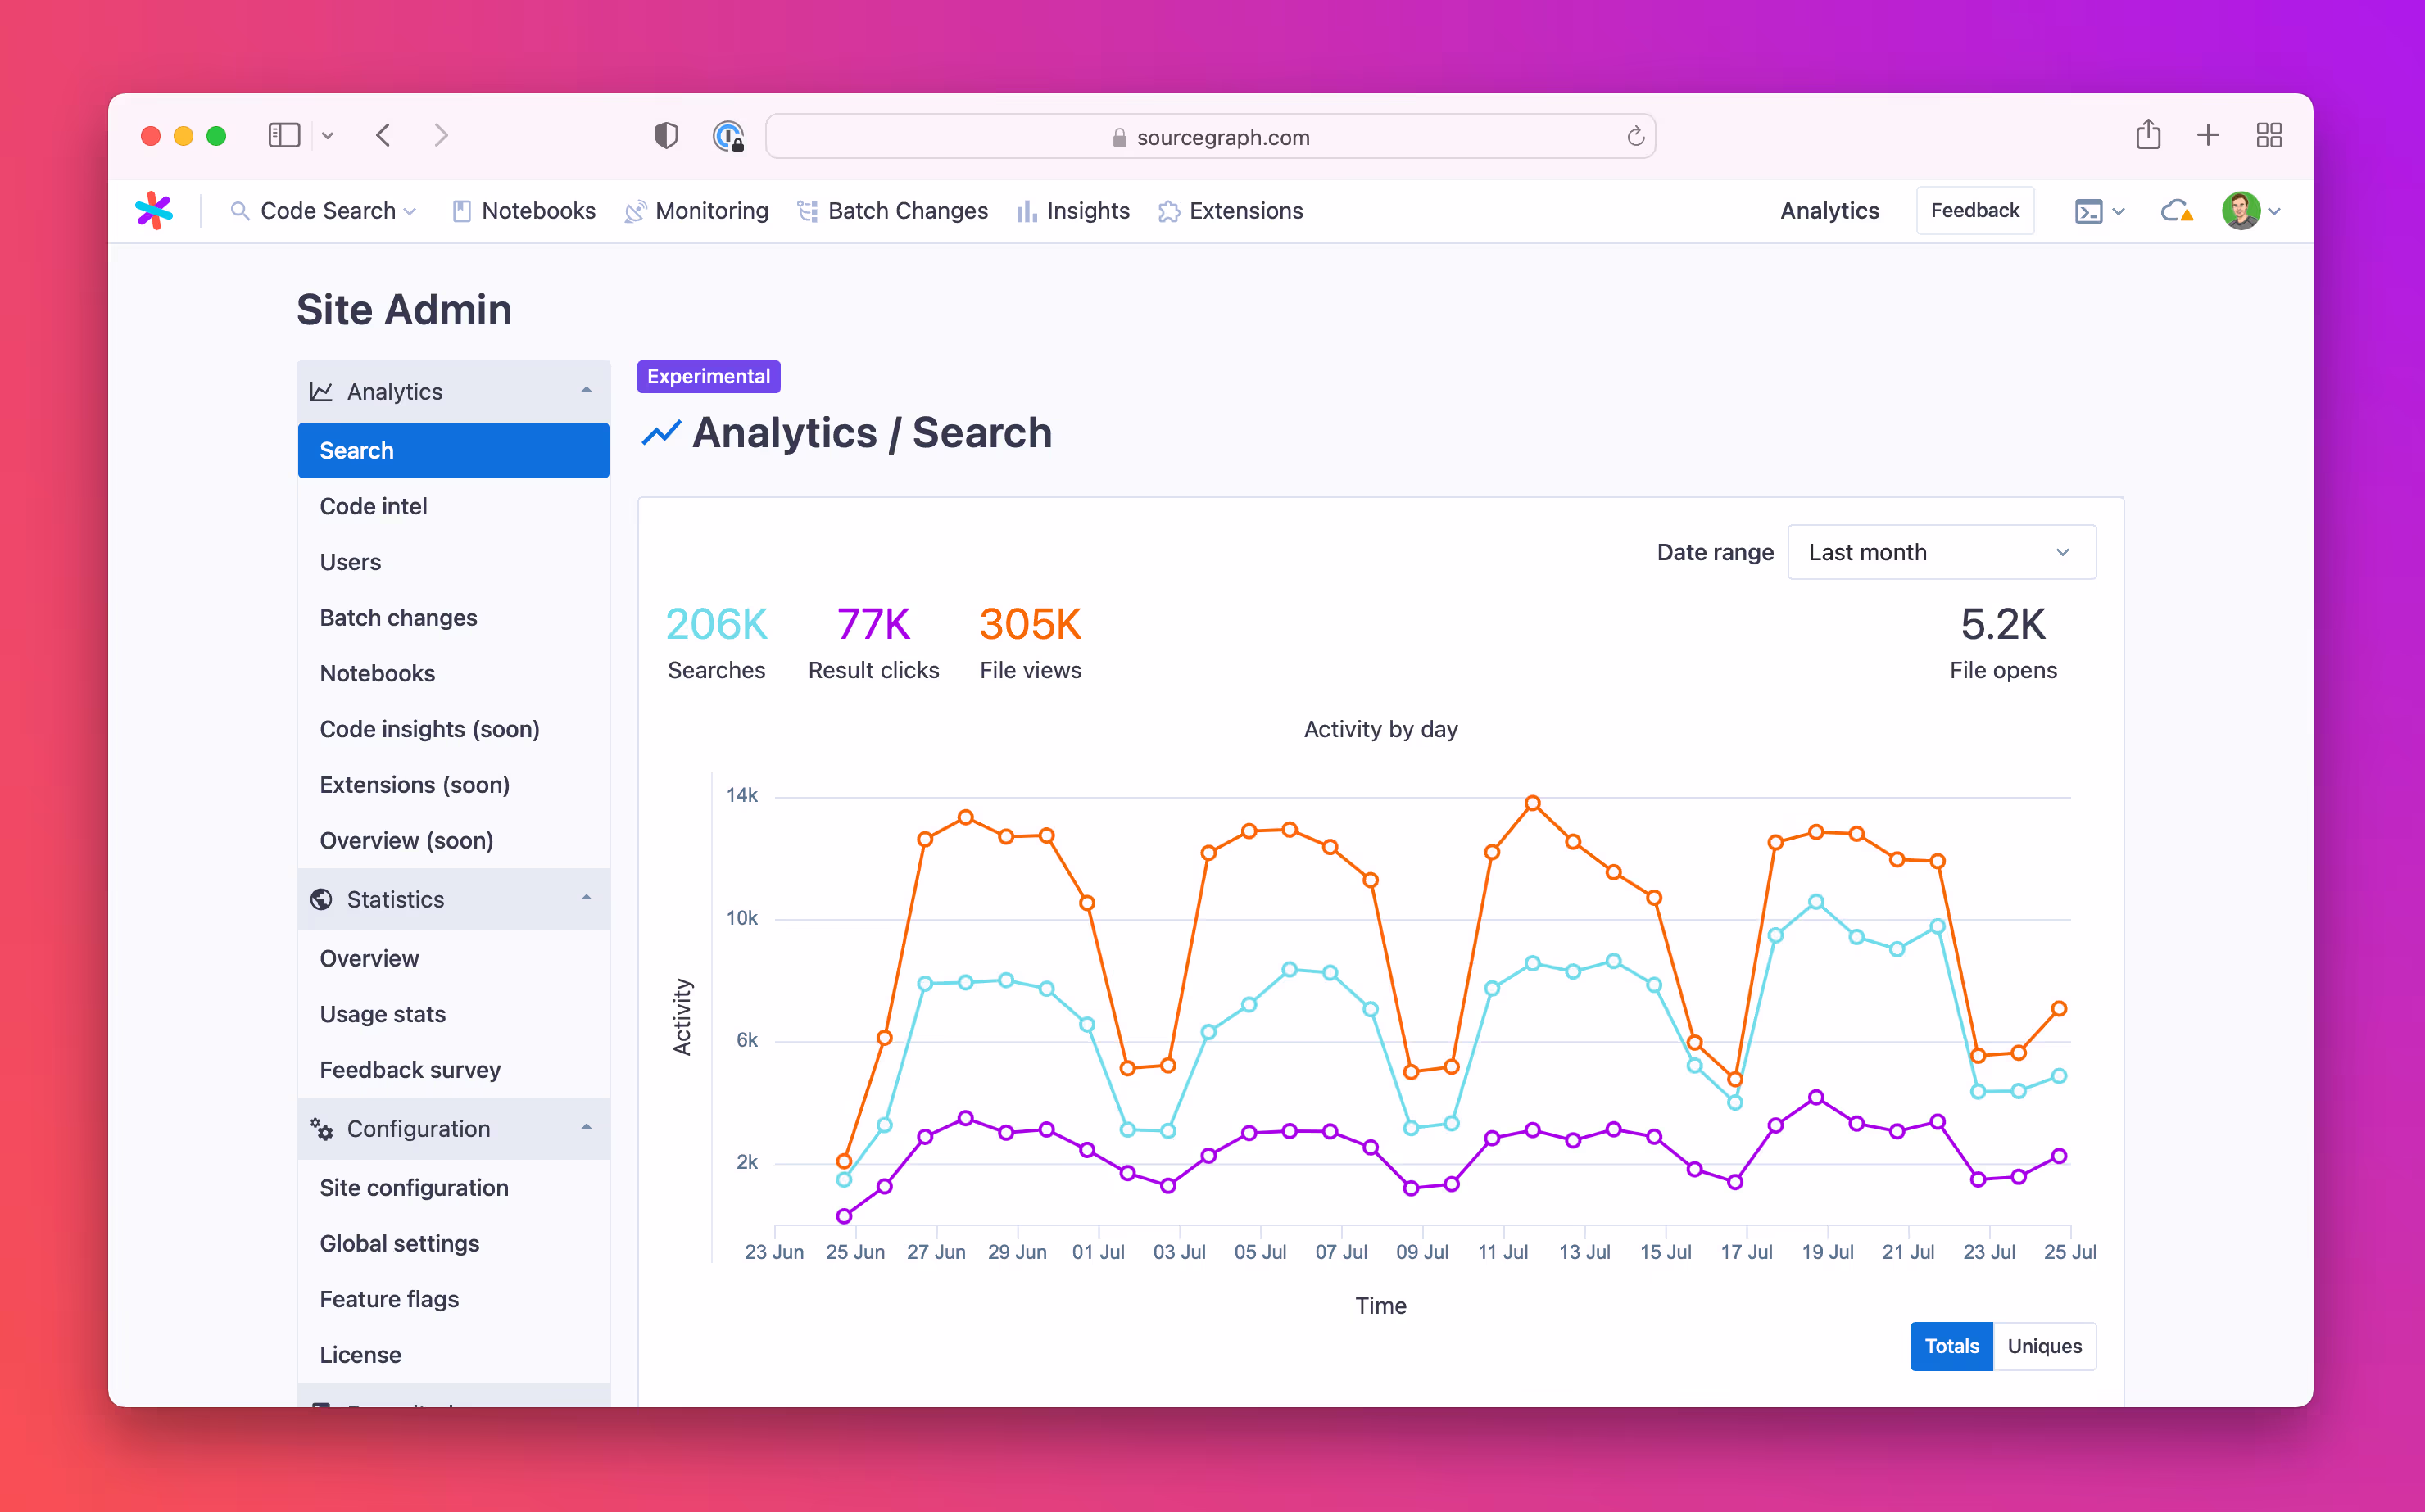
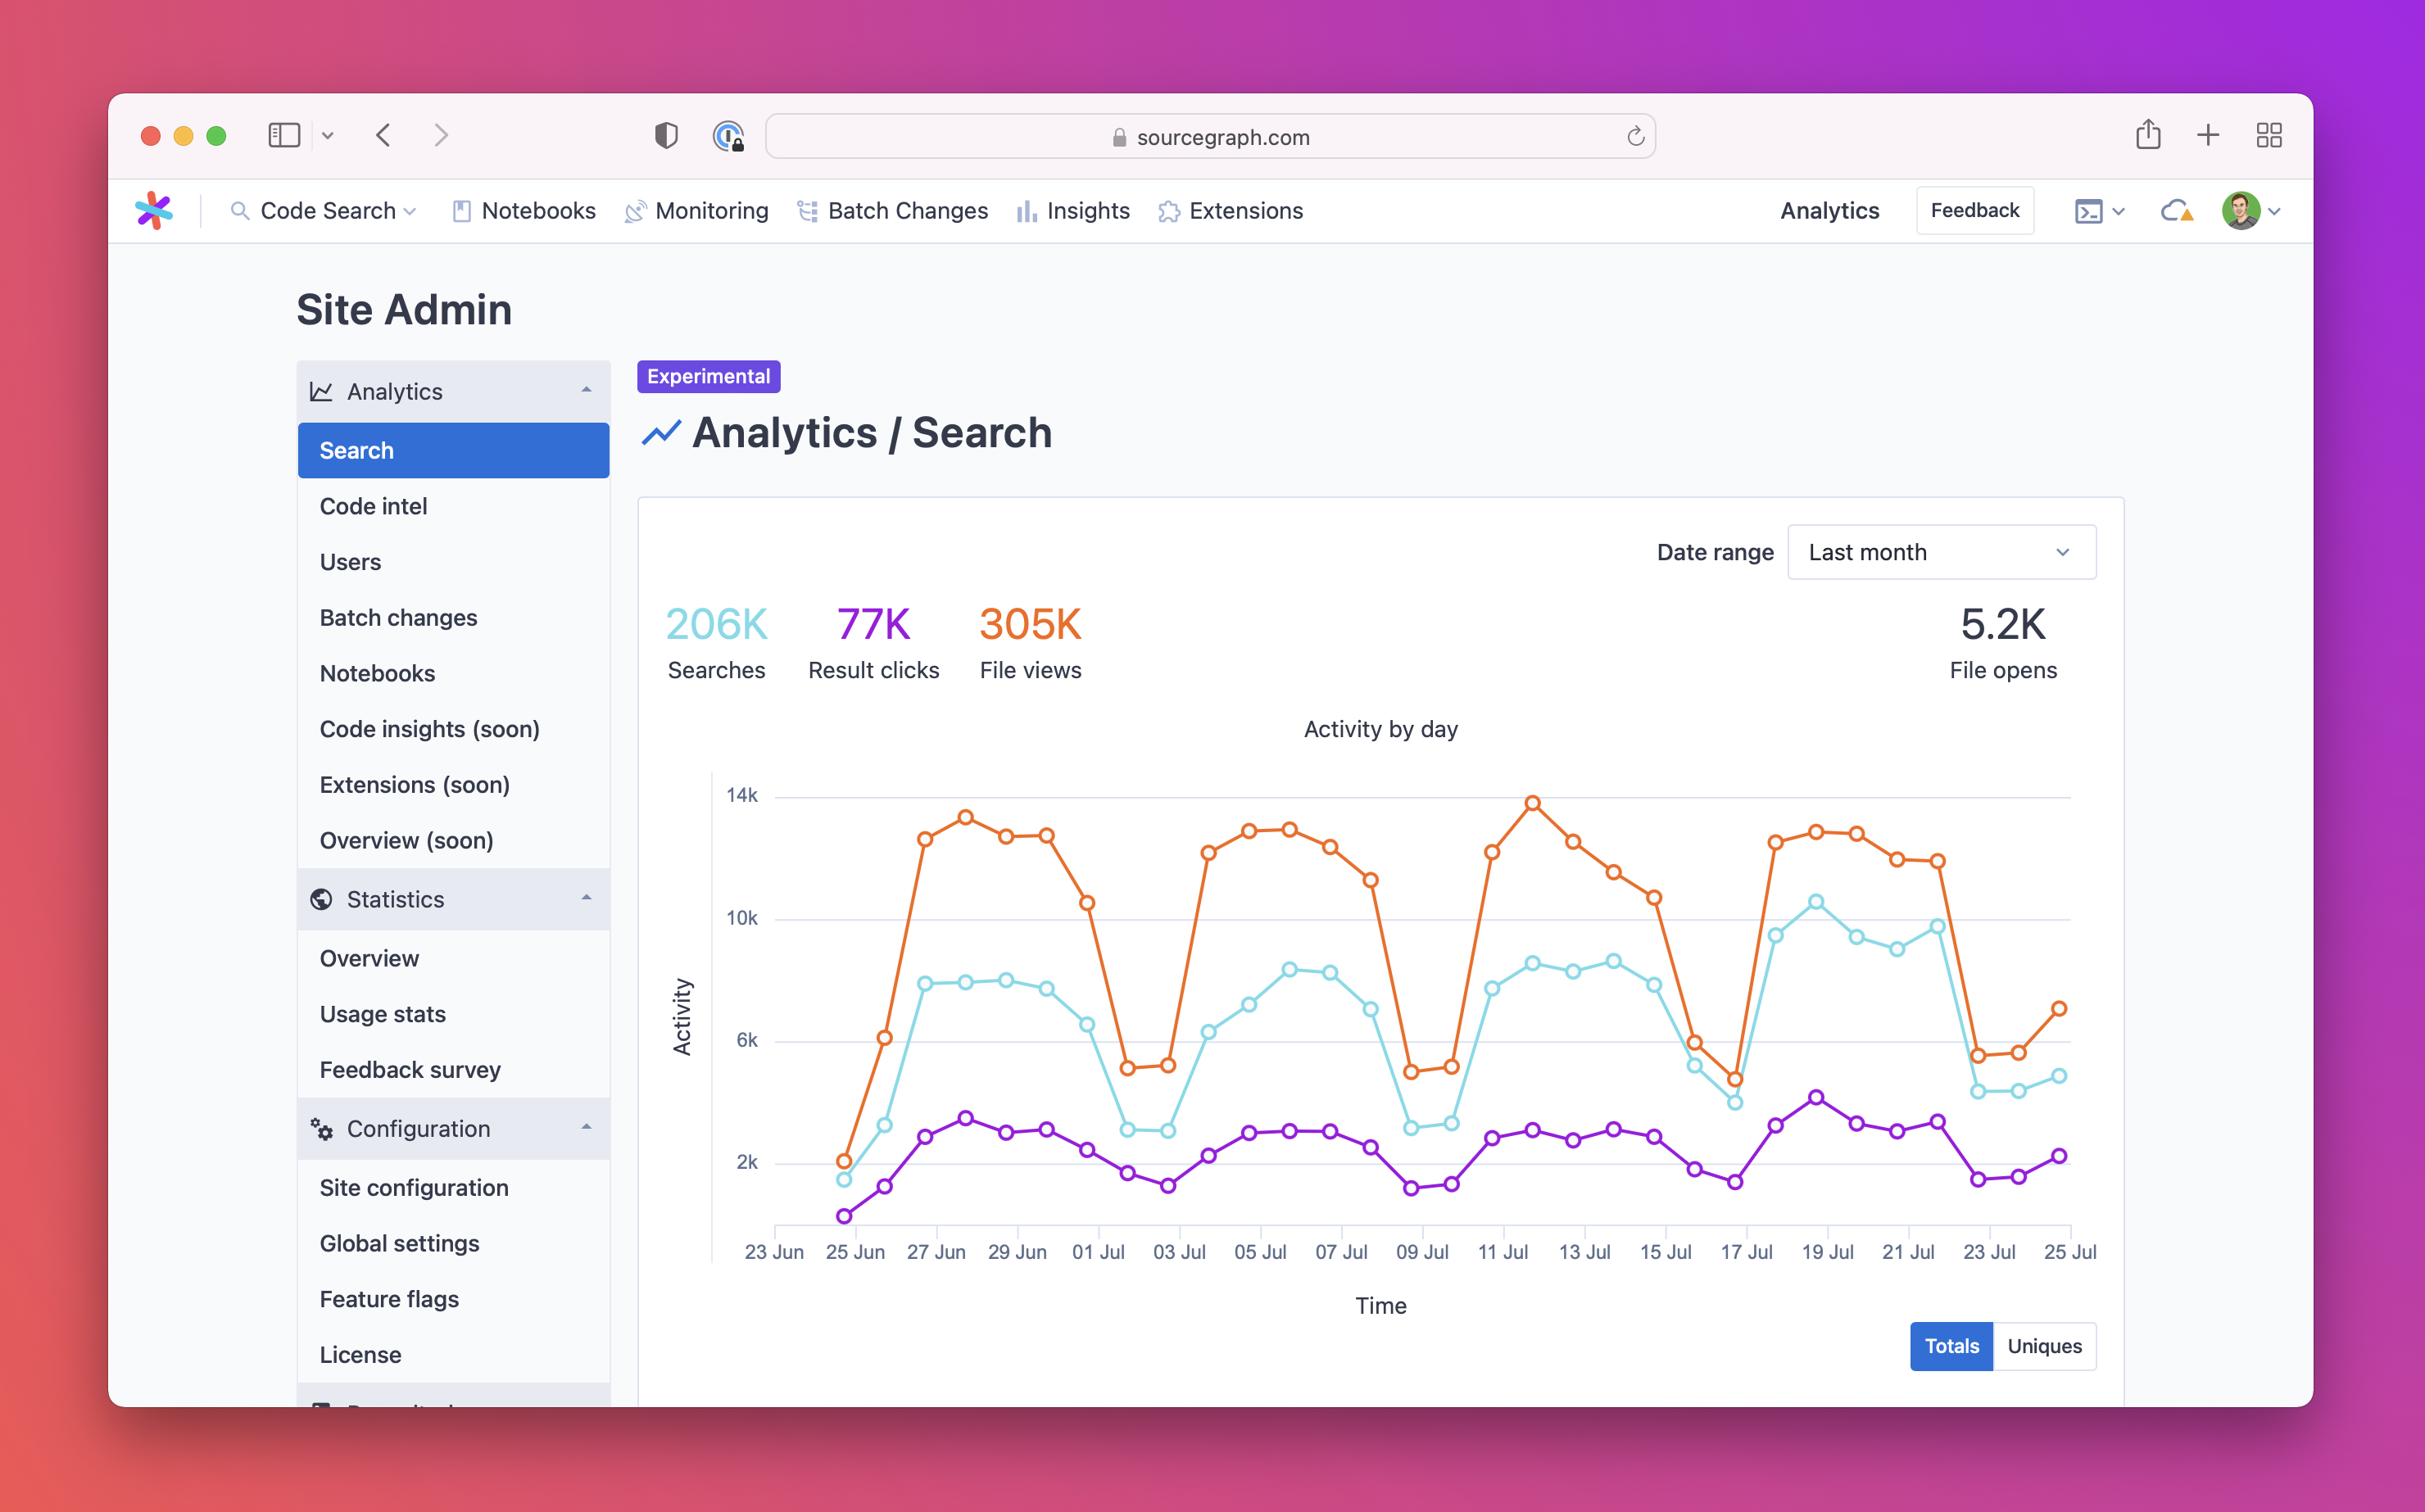
The new admin analytics generally consists of charts that detail usage over time and value calculators that help clarify the amount of time saved over alternative ways of solving specific use cases.
These analytics capture and measure metrics such as:
All charts feature a date range selector and a toggle to allow users to view the adoption of a feature over time by both volume and the number of users. In addition, each section features KPIs unique to that feature to help detail major areas of use.
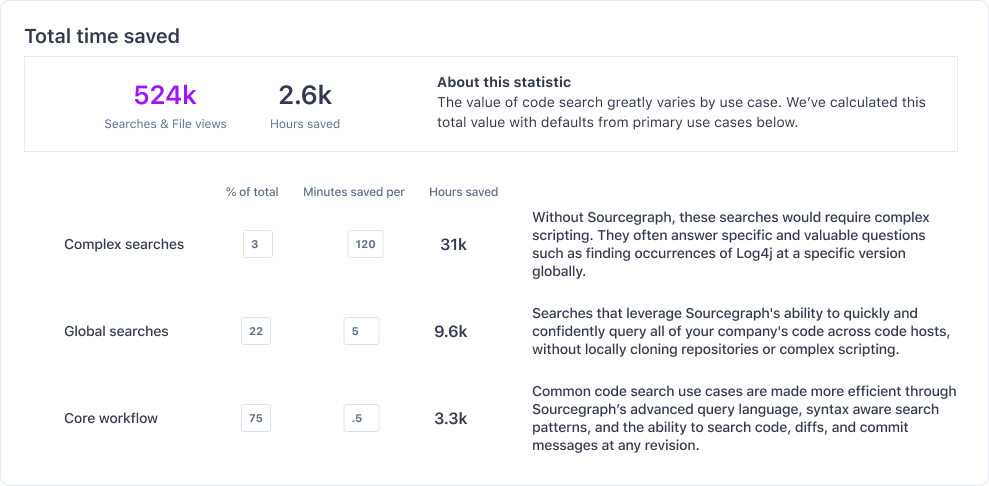
The feature value calculators use data derived from the event logs and are designed to allow users to edit the default time-saved values. We've designed it in this way to allow users to adjust to conditions in their environment.
Additionally, we are calculating the daily, weekly, and monthly active users and displaying the average days used. These metrics should help admins determine the level of adoption among users.
As part of the theme of improving the admin experience, we're also focusing on projects like improving our resource estimator, making it easier to understand instance health, and perhaps most importantly, improving the upgrade process. All of these changes will make it easier for admins to deliver value to the +1 million developers who use Sourcegraph today.
Admin analytics is now available in Sourcegraph 3.42. If you're already a Sourcegraph customer, you can get started by upgrading to version 3.42.

With Sourcegraph, the code understanding platform for enterprise.
Schedule a demo